Python 编程与环境笔记:系列目录

matplotlib 绘制折线图
1
2
3
4
5
6
7
8
9
10
11
12
from matplotlib import pyplot as plt
%pylab inline#jupyter 要加这句


x = [1,2,3,4,5]
y = [num**2 for num in x]
plt.plot(x, y, color='green', marker='o', linestyle='solid')
plt.title('x**2')
plt.xlabel('x value')
plt.ylabel('y value')
plt.show()
# plt.savefig('plot')

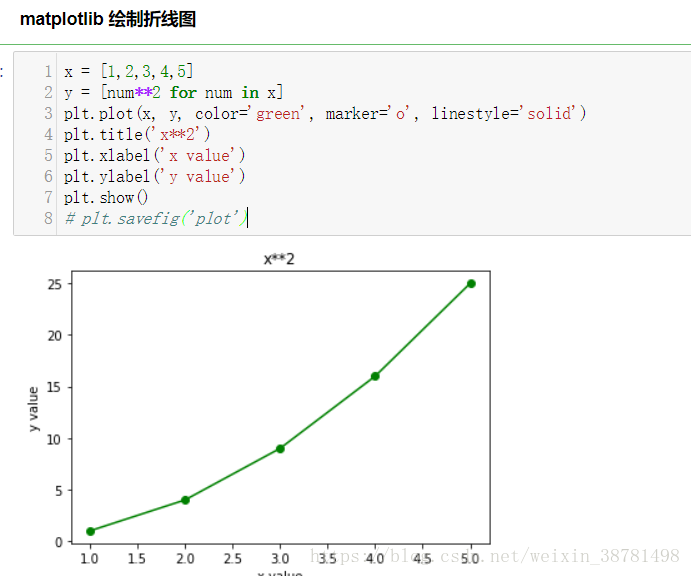
在 Jupyter Notebook 中使用 Matplotlib 画图配图

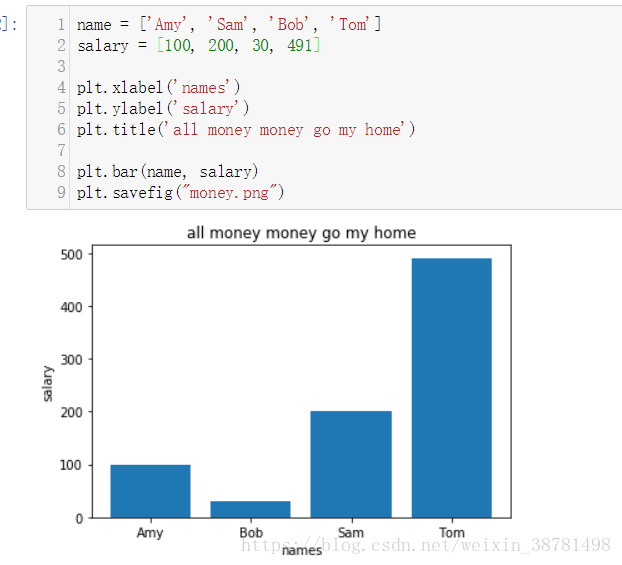
matplot绘制条形图
1
2
3
4
5
6
7
8
9
name = ['Amy', 'Sam', 'Bob', 'Tom']
salary = [100, 200, 30, 491]

plt.xlabel('names')
plt.ylabel('salary')
plt.title('all money money go my home')

plt.bar(name, salary)
plt.savefig("money.png")

在 Jupyter Notebook 中使用 Matplotlib 画图配图

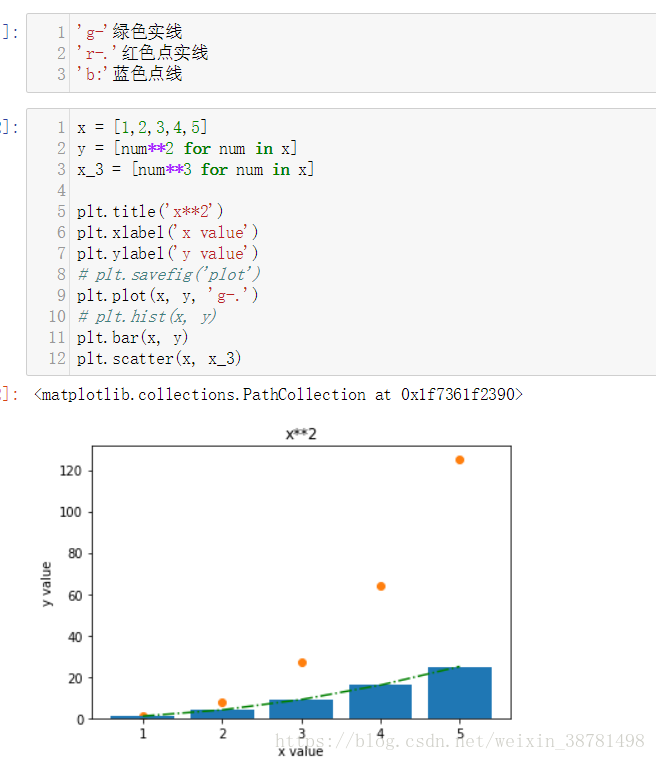
在 Jupyter Notebook 中使用 Matplotlib 画图配图